Bitcoinometrics: The Technical Indicators Driving BTC Prices
Welcome to Issue VI of Bitcoinometrics. This issue will delve into the significant influence that technical indicators have on the Bitcoin Price Index. Even though many of these metrics primarily focus on short-term price movements, their importance in predicting long-term trends should not be understated. Therefore, it's essential to consider them as part of our comprehensive price index.
Technical indicators provide key insights into market sentiments and help discern potential price patterns. Despite the seemingly transient nature of some of these indicators, their ability to signal broader market shifts can impact long-term price trajectories. These short-term signals often contribute to shaping long-term trends and, in turn, influence the Bitcoin Price Index. Let's look at them individually.
Trading volume
This is a measure of how much Bitcoin is being bought and sold. Generally, high trading volumes indicate that a lot of transactions are being made, which can signal strong interest in Bitcoin. However, high trading volume can be associated with both price increases and decreases, as it simply indicates the number of Bitcoins being traded, not whether most transactions are buys (which would push the price up) or sells (which would push the price down).
To better understand whether the market sentiment is bullish (expecting prices to rise) or bearish (expecting prices to fall), I can consider the following indicators in combination with trading volume:
- Price Trends: When the trading volume is high, are the prices generally moving upwards or downwards? If prices rise with high trading volume, this could suggest bullish sentiment, while falling prices with high trading volume could suggest bearish sentiment. Also, we can look at the 50-Day & 200-Day moving averages.
- Volume Oscillators: These technical indicators, such as the Chaikin Money Flow (CMF) or On Balance Volume (OBV), can provide a way to quantify how volume influences price movement.
- Relative Strength Index (RSI): The RSI is a momentum indicator that measures the speed and change of price movements. An RSI above 70 typically indicates a market is overbought (bearish signal), while an RSI below 30 indicates a market is oversold (bullish signal).
But keep in mind that predicting future price movements based on past data is inherently uncertain and involves a significant degree of risk.
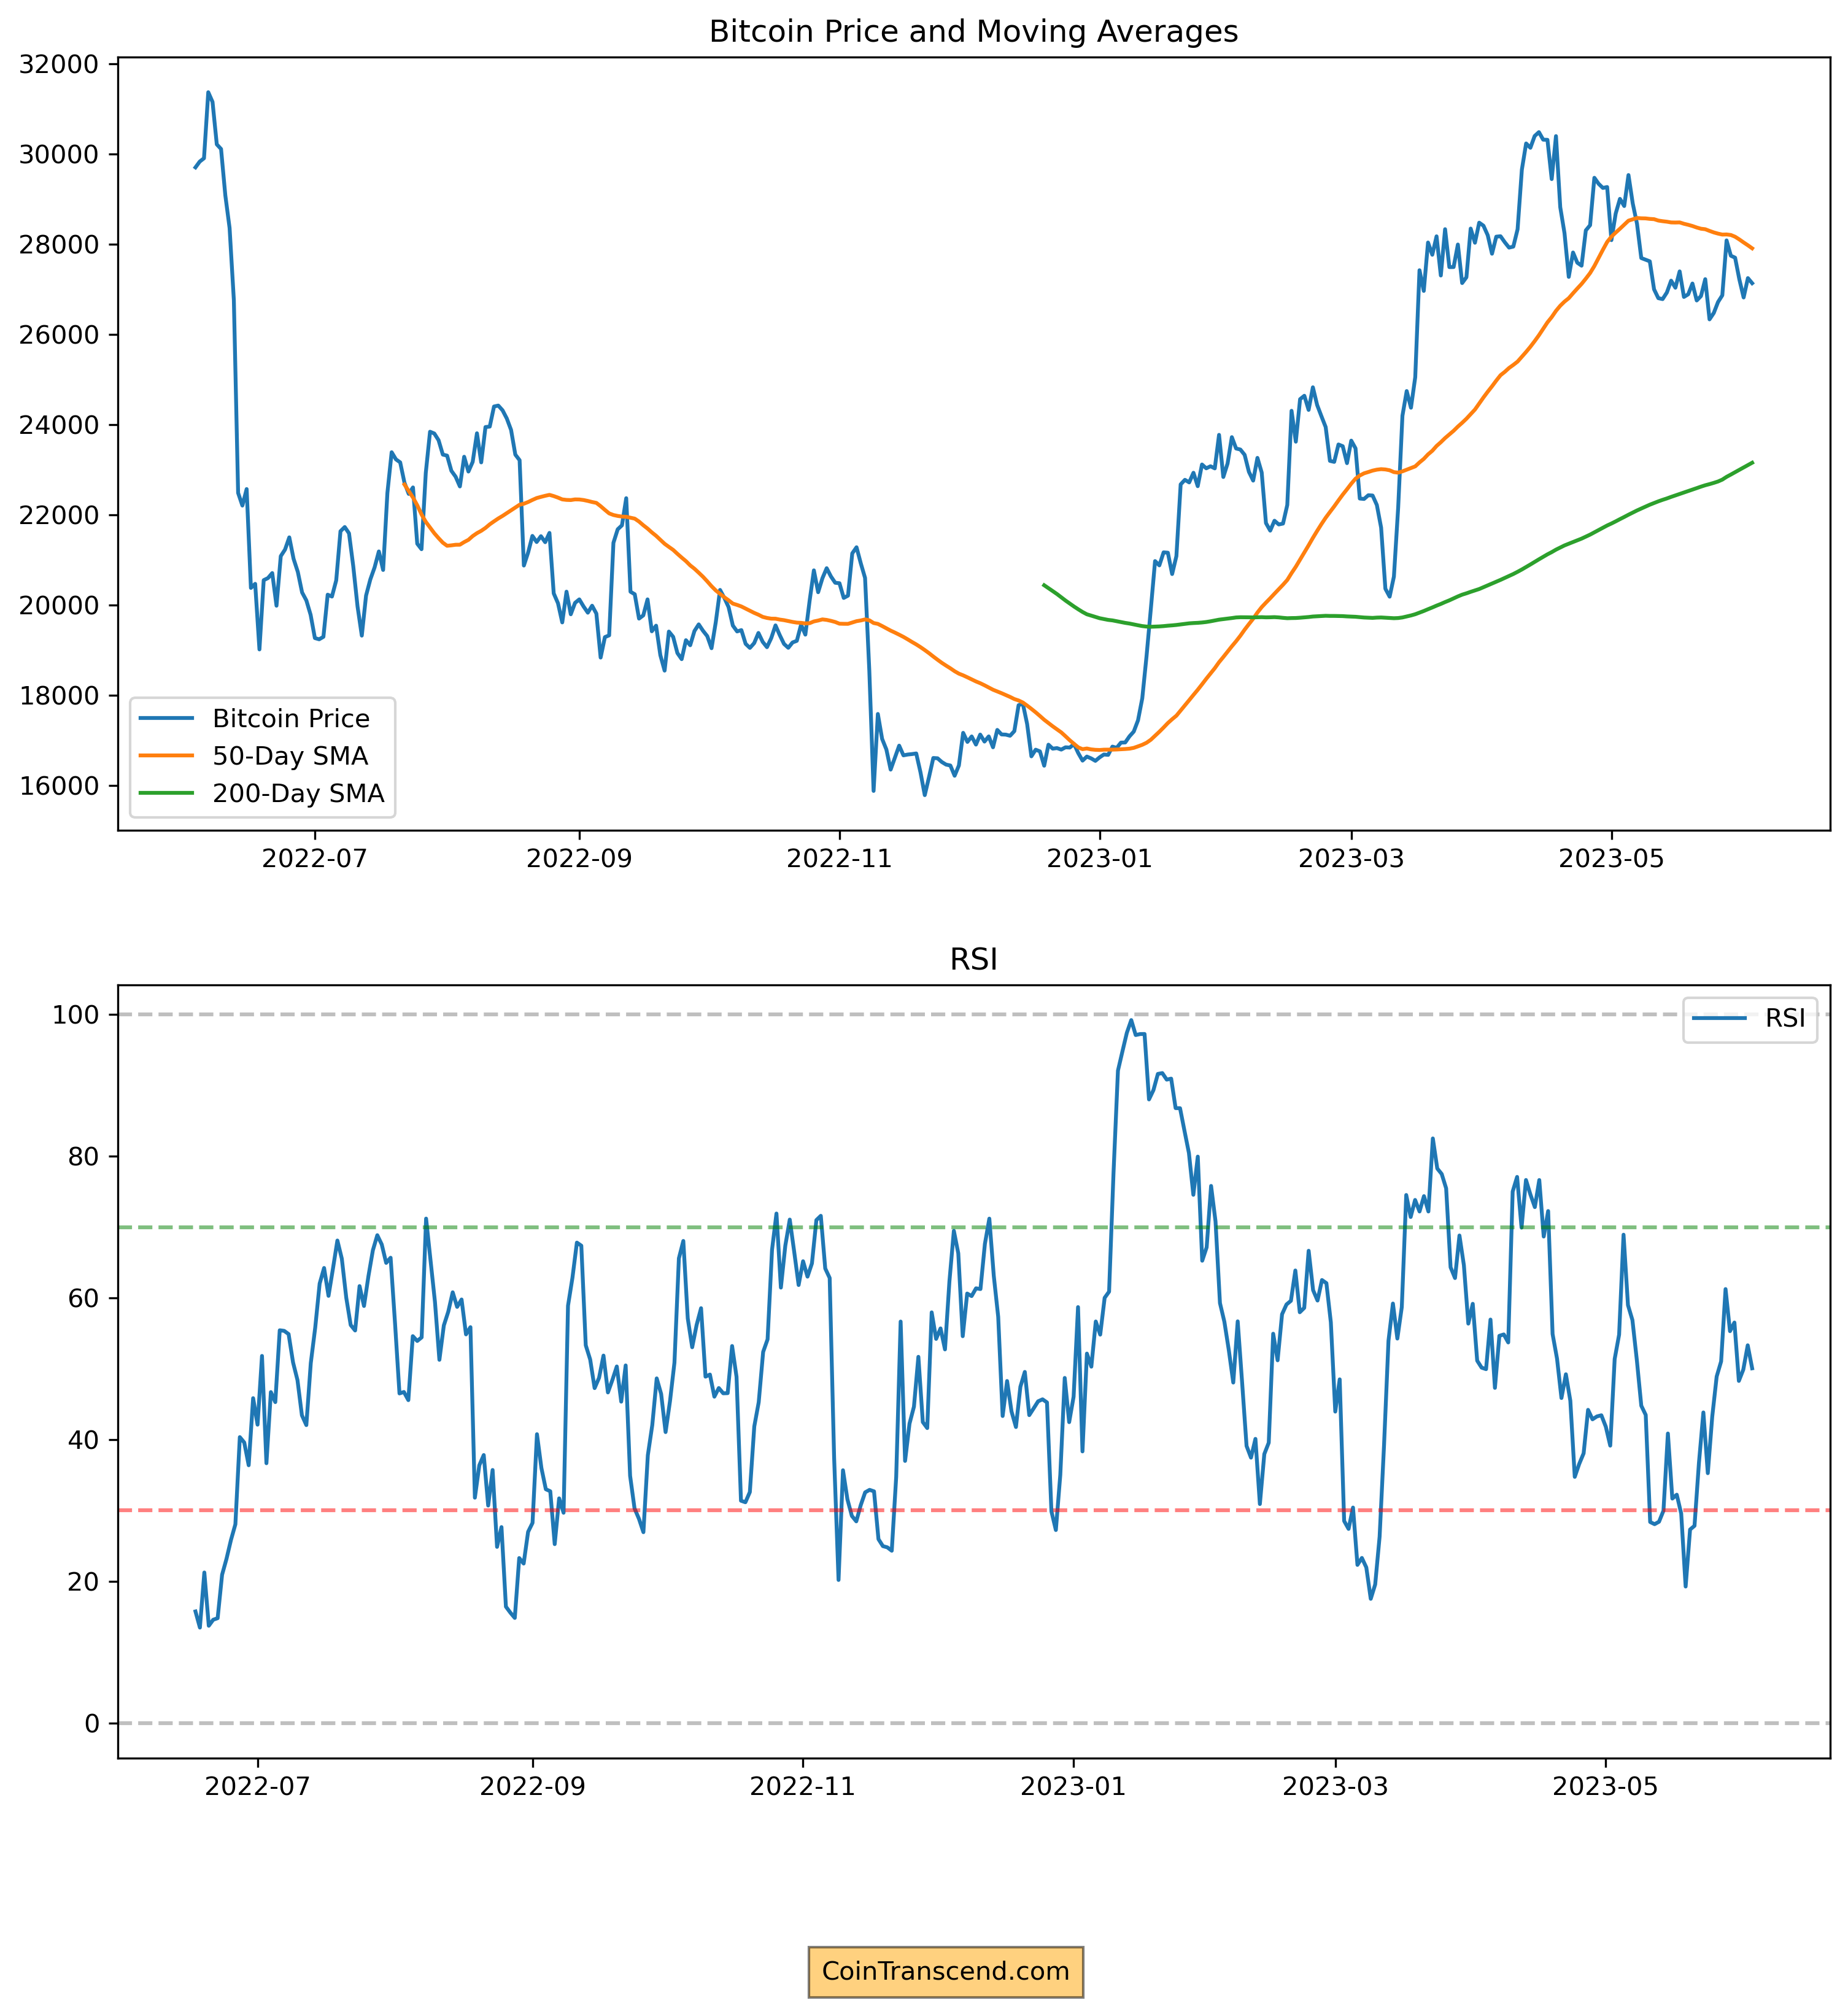
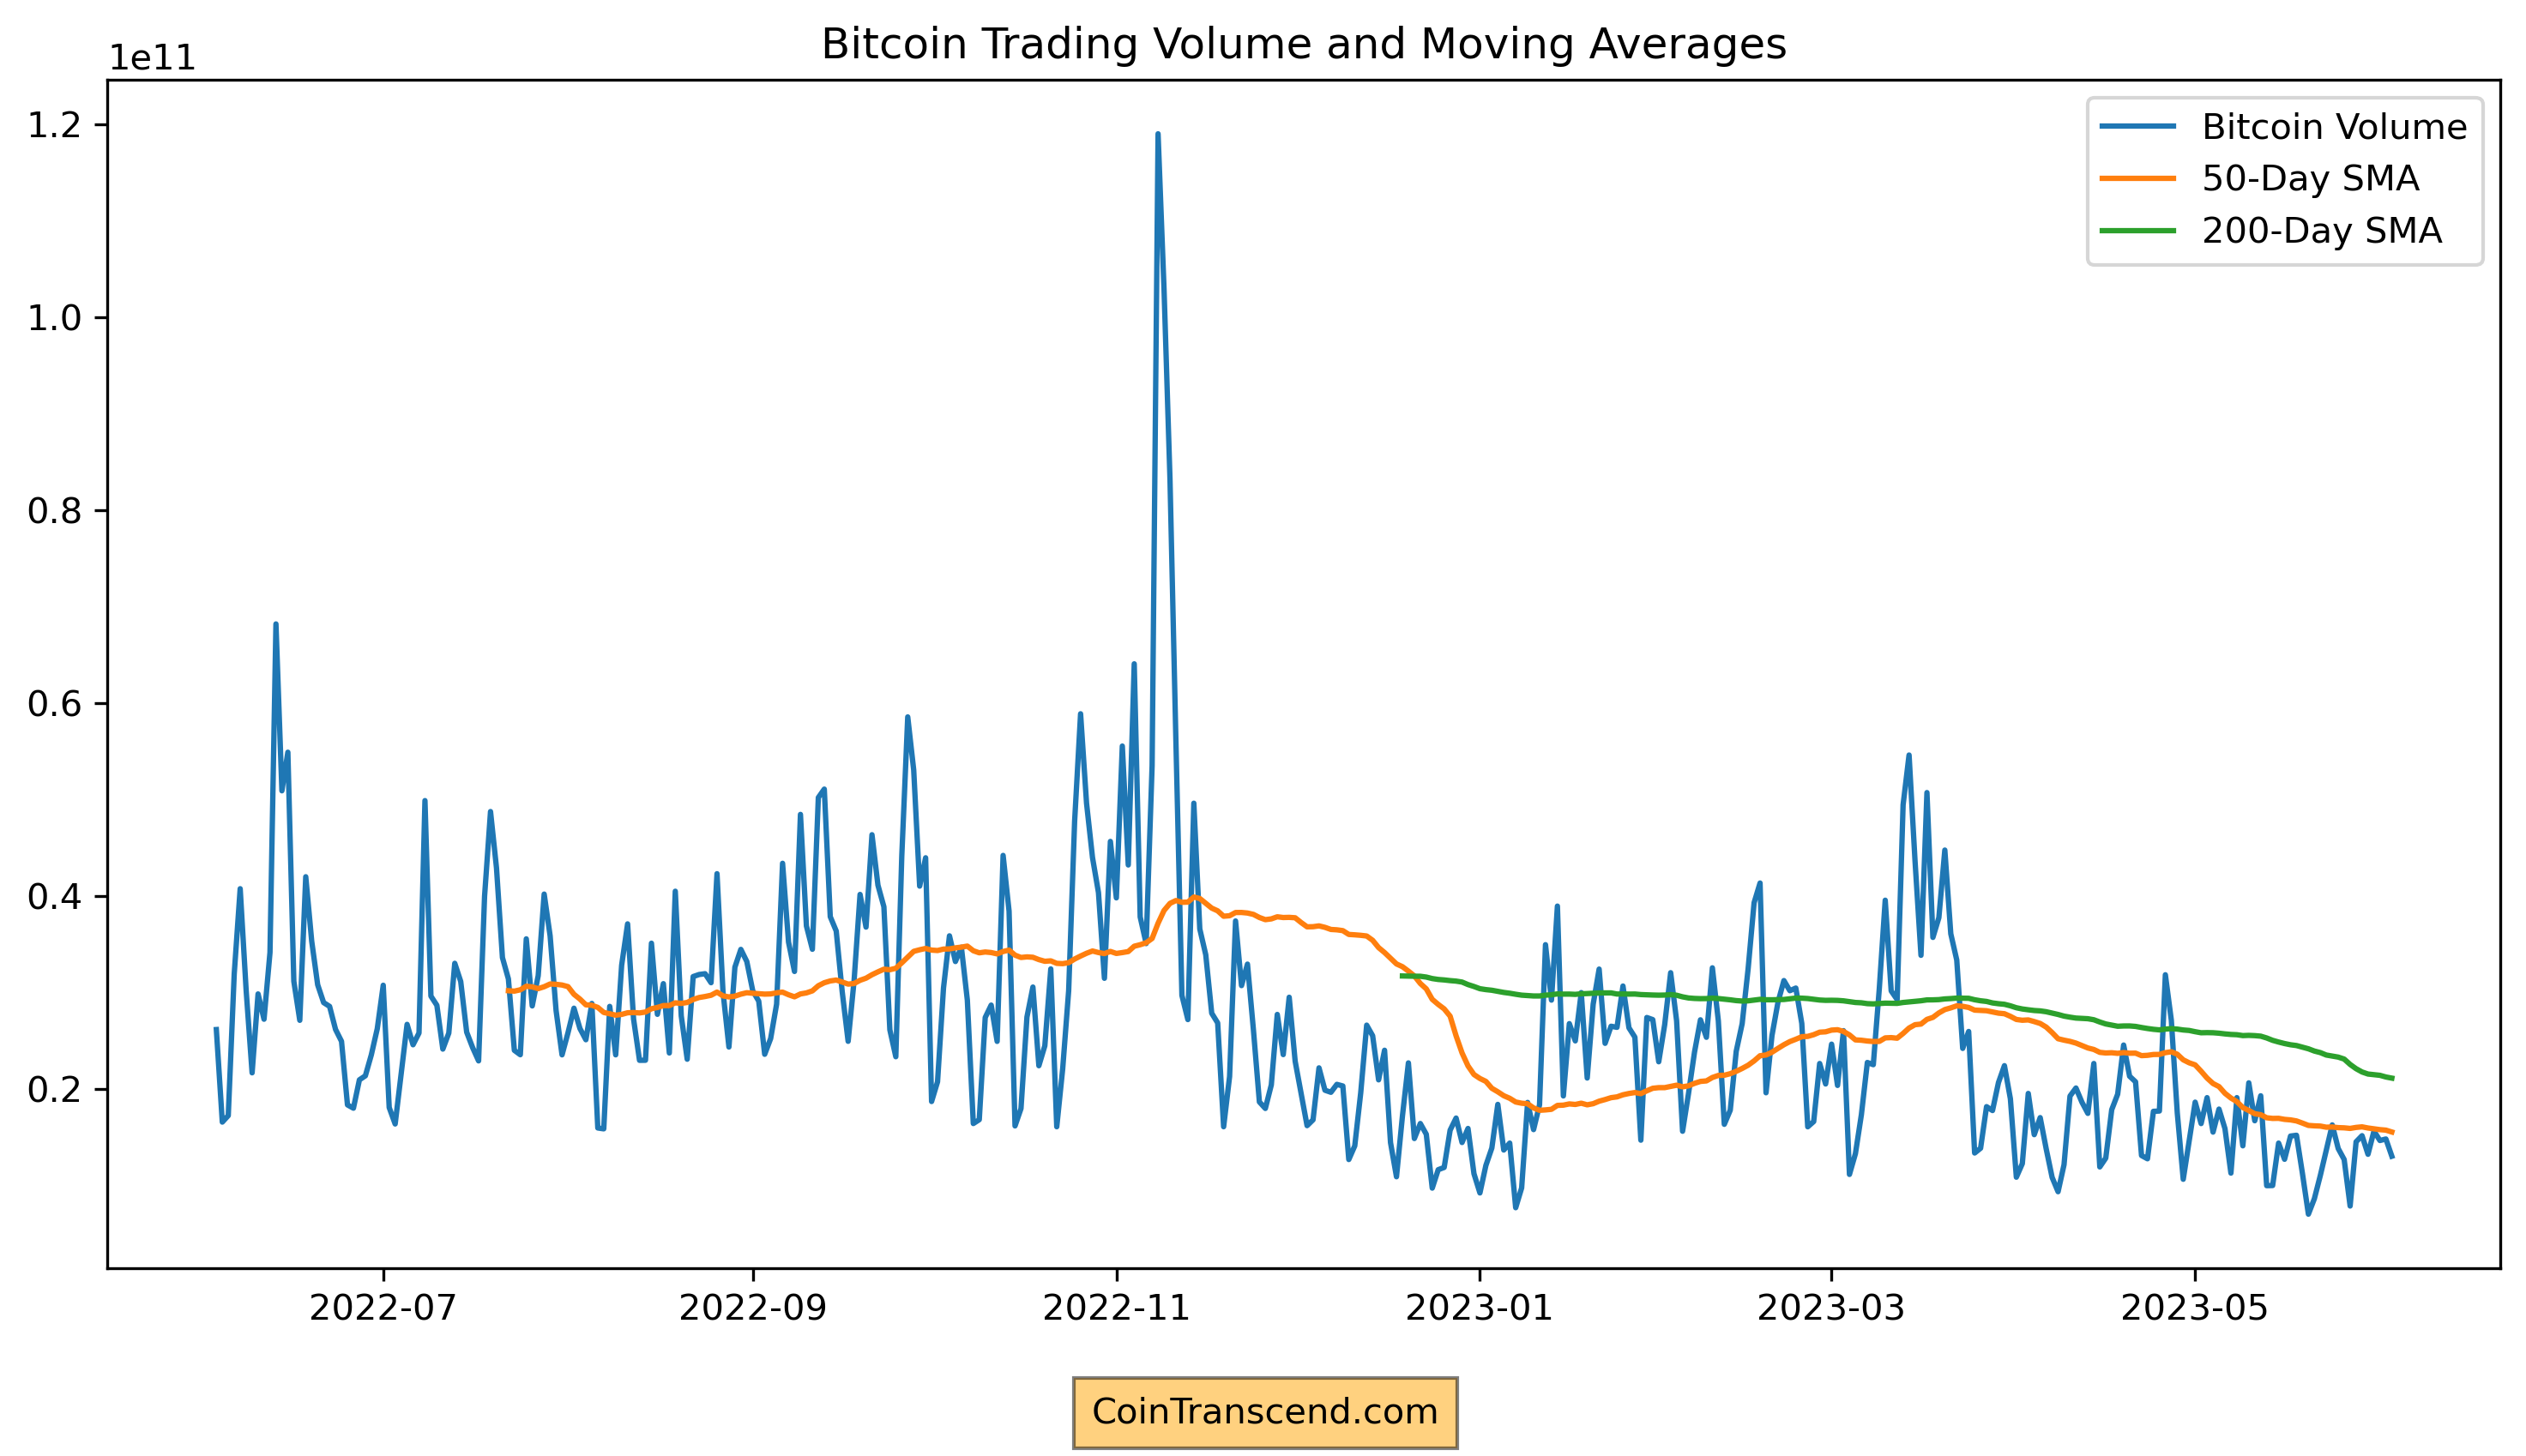
Every substantial surge in the trading volume manifests as a sharp increase or decrease in Bitcoin's price. This correlation indicates that significant price volatility often accompanies higher trading activity.
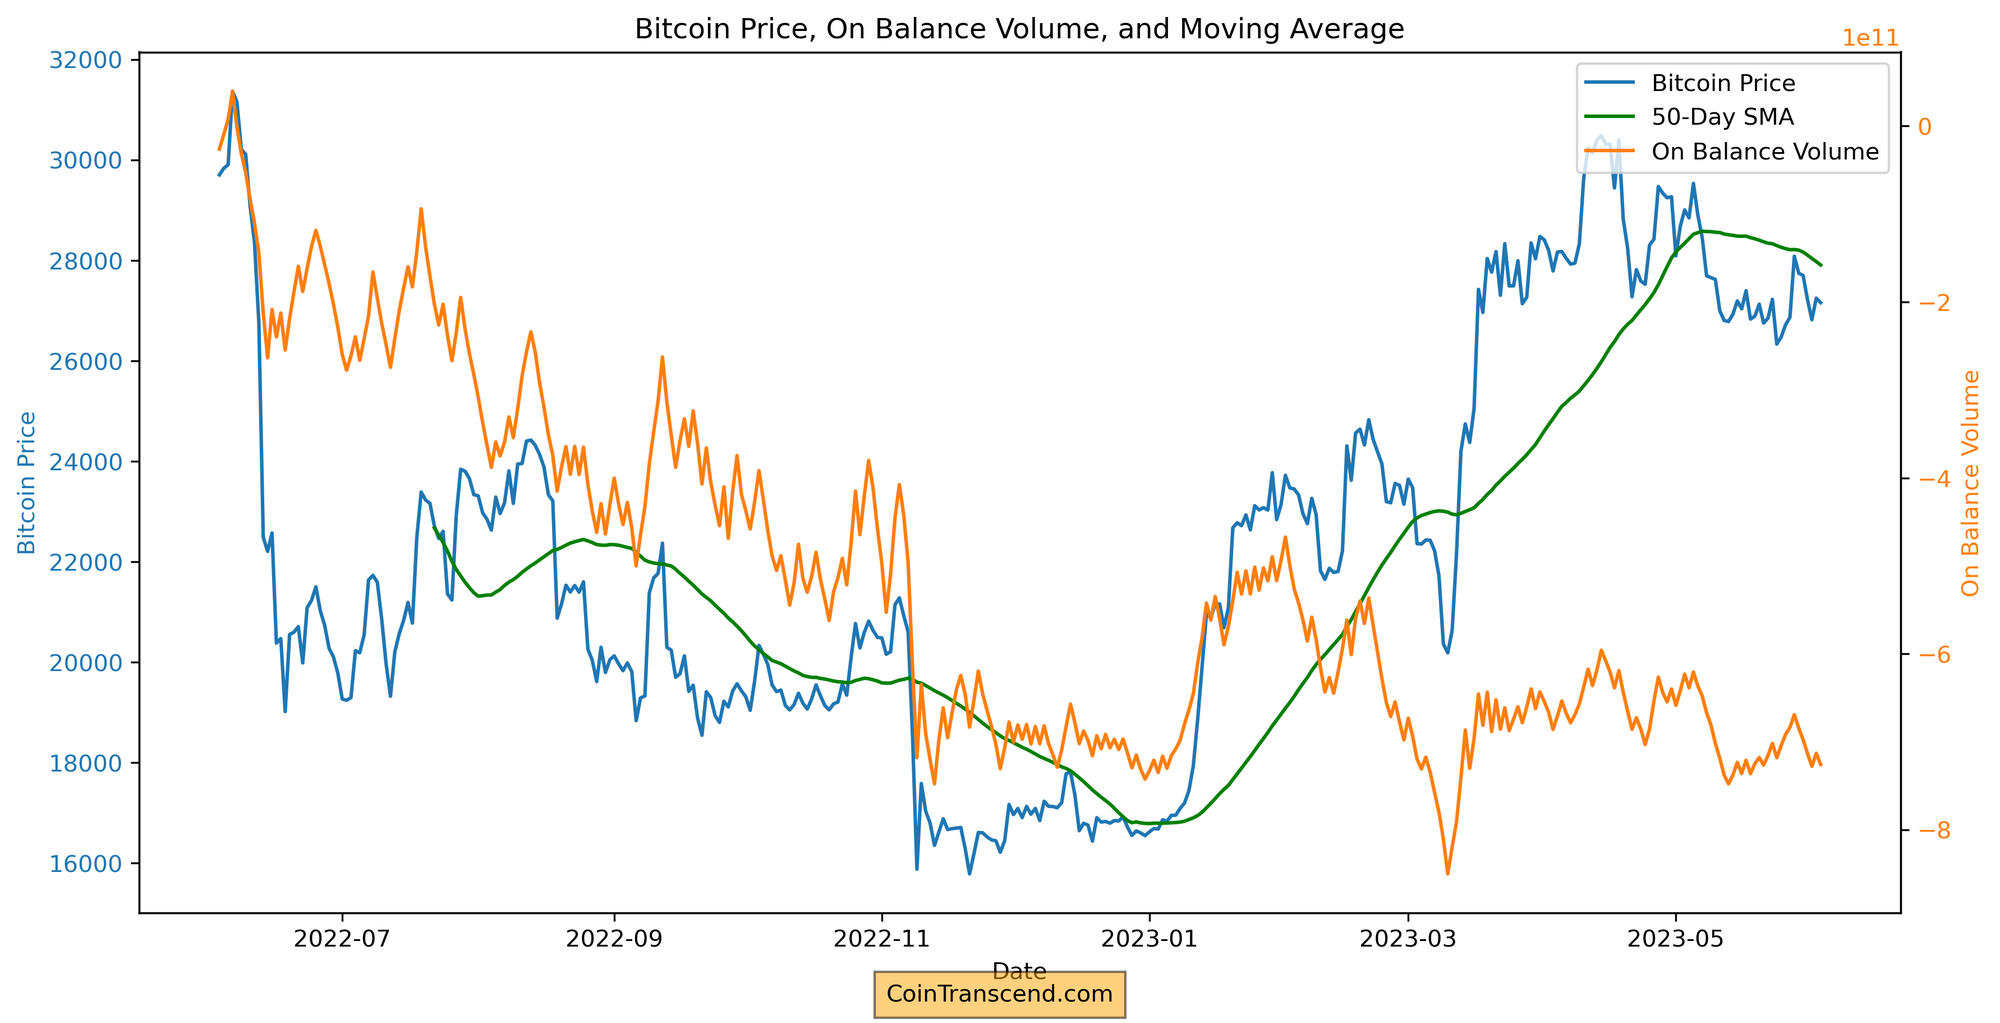
On Balance Volume (OBV)
It is a momentum indicator that uses volume flow to predict changes in price. Joseph Granville first developed the OBV metric in the 1960s. He believed that when volume increases sharply without a significant change in the stock's price, the price will eventually jump upward, and vice versa.
The OBV is calculated by adding the day's volume to a running cumulative total when the security's price closes up, and the volume is subtracted from the running total when the security's price closes down. In this way, the OBV provides a running total of volume and shows whether this volume is flowing in or out of a given security.
Bitcoin Distribution Analysis: Insight into Wallet Balances
By examining and understanding trends in Bitcoin's distribution across various wallet sizes, we can glean valuable insights that could potentially inform future price movements.
Here's why we are pulling this data and how it's useful:
Understanding Wealth Distribution: The distribution of bitcoin wealth among top holders can give us insights into the market's overall health.
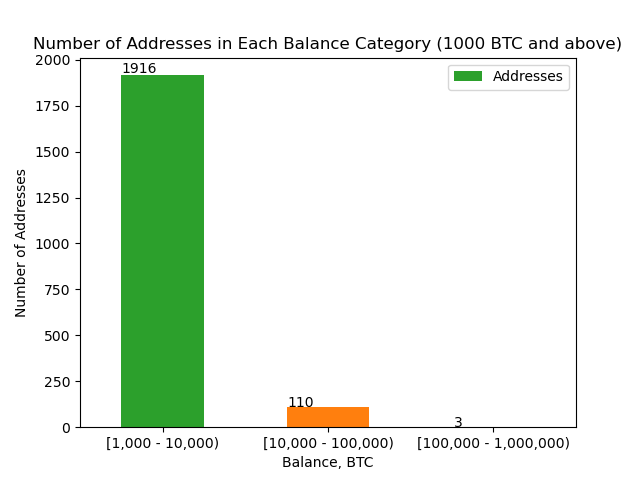
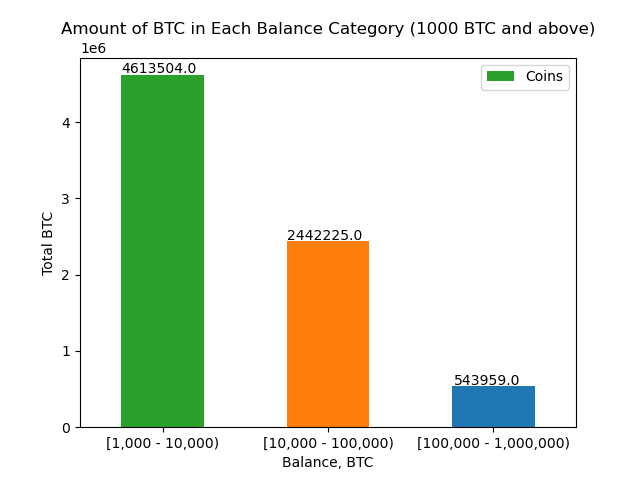
Tracking Large-Scale Transactions: Large transactions (for instance, from wallets holding over 1000 BTC) can significantly impact the market.
Assessing Market Sentiment: Changes in the number of addresses or coins within each balance category can signal shifts in market sentiment. For instance, increasing the number of addresses holding 1,000-10,000 BTC might suggest that more investors are accumulating Bitcoin, possibly indicating bullish sentiment.
Identifying Holding Patterns: This data allows us to see how many addresses hold onto their Bitcoin despite market fluctuations.
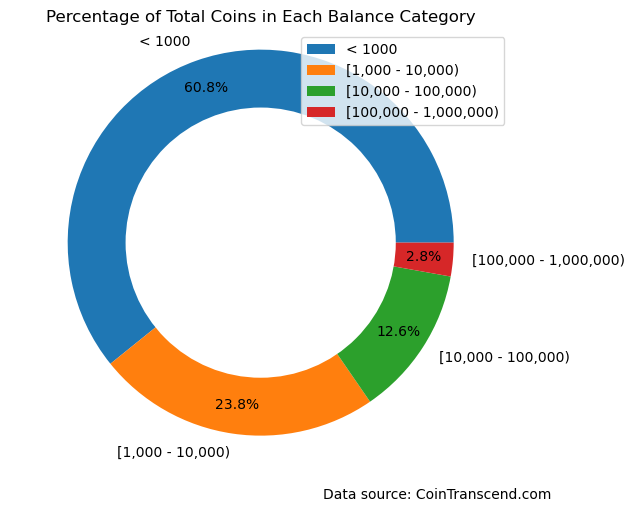
And finally, let's look at the whole BTC distribution. Obviously, for long-term price stabilization, I would prefer to see a greater % in the "<1000" category
Market sentiment
This can be gauged through tools like sentiment analysis on social media and news articles & Google Analytics. Positive sentiment can potentially lead to price increases, while negative sentiment can lead to price decreases.
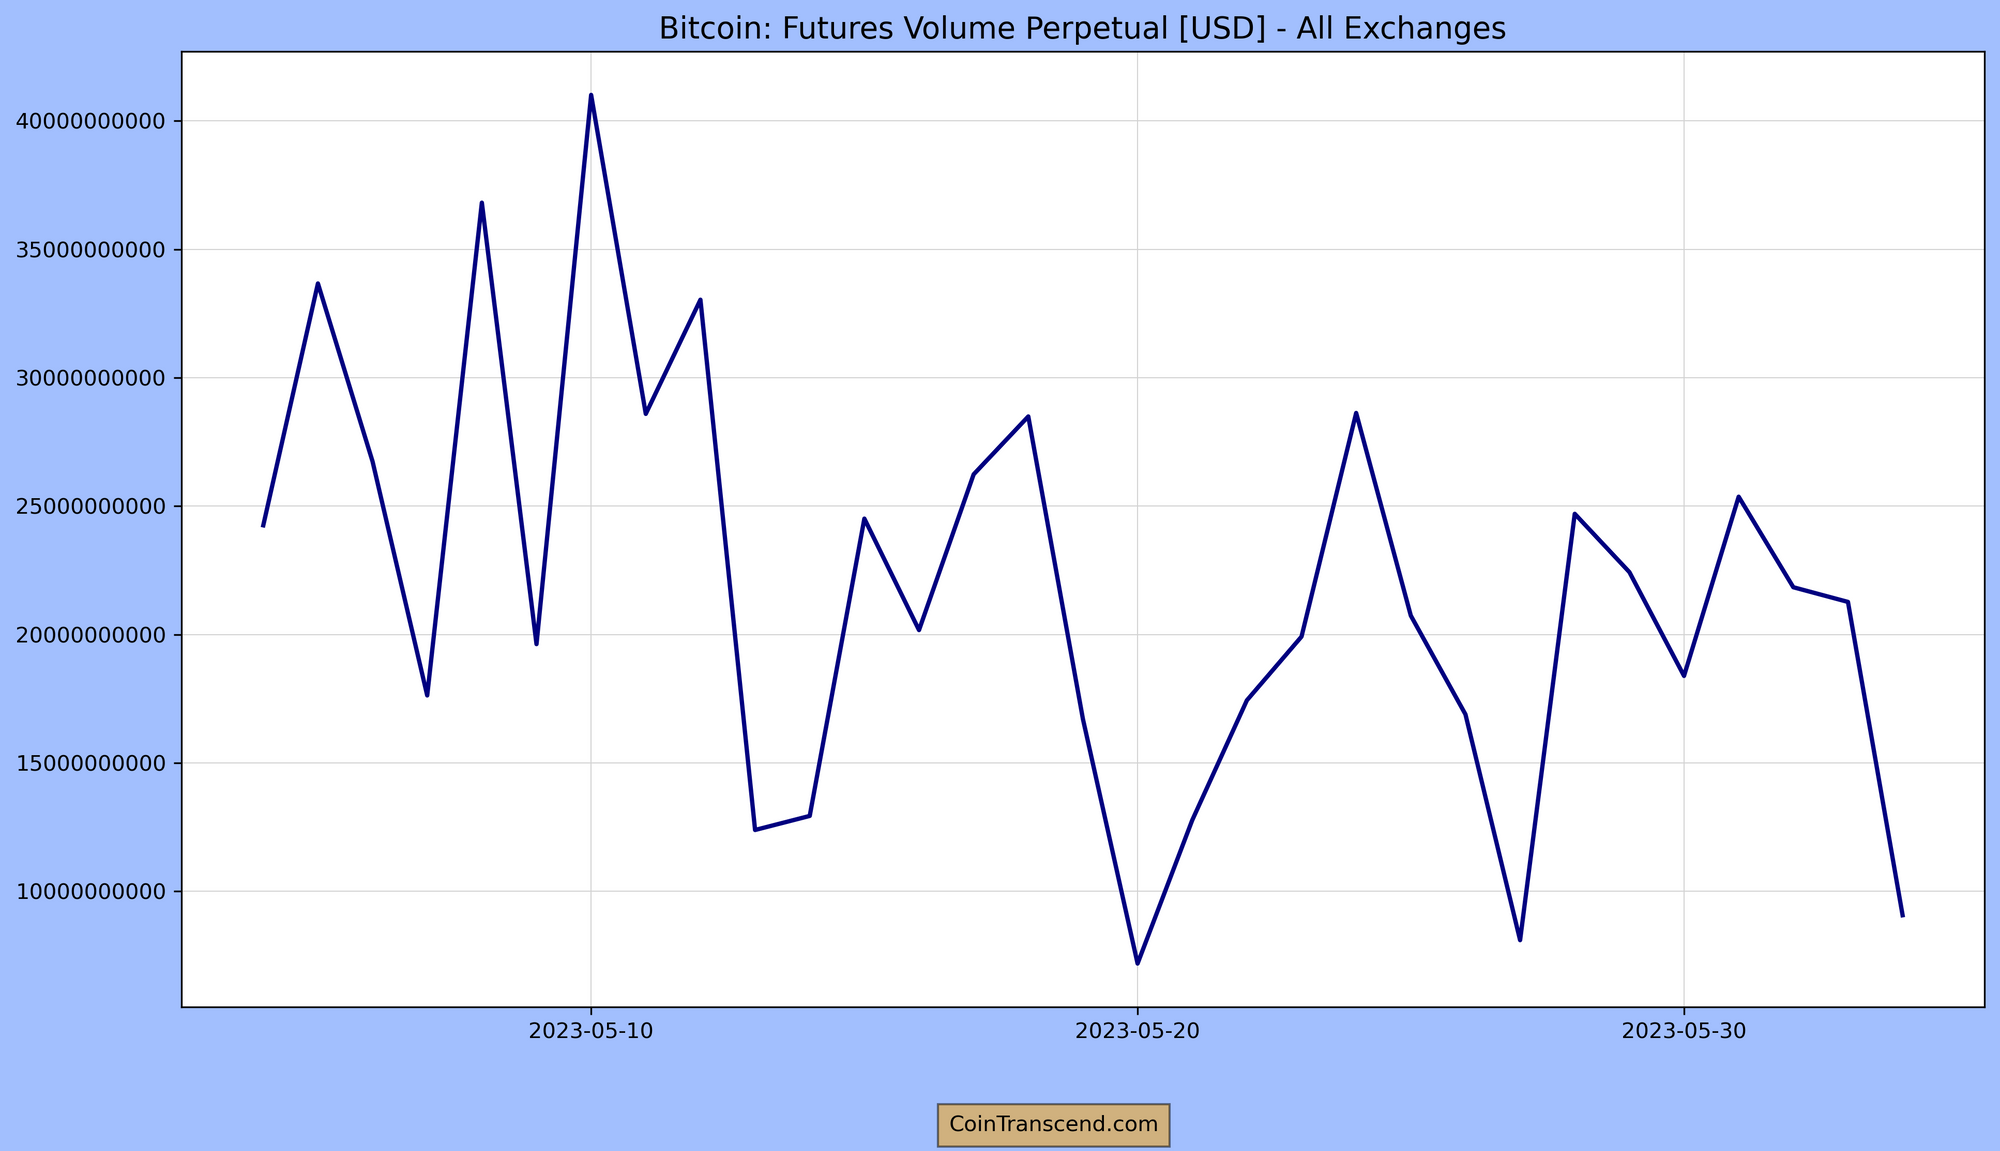
Futures Market Data
Large differences between spot prices and futures prices could indicate strong demand or supply. If the futures prices are significantly higher than the spot price (contango), it could indicate strong future demand. Conversely, if futures prices are lower than the spot price (backwardation), it could indicate a strong future supply.
What is a Perpetual Futures Contract?
A perpetual futures contract, also known as a perpetual swap, is a special type of futures contract that doesn't have an expiry or settlement date. It is designed to closely track the spot price of an underlying asset, like Bitcoin. Pretty much all the popular exchanges offer Bitcoin Futures.
In traditional futures contracts, the buyer agrees to purchase, and the seller agrees to deliver, a specified amount of an underlying asset at a predetermined price at a certain future date. But with perpetual futures contracts, the contract can be held indefinitely, and the position is only closed when the trader decides to close it.
Perpetual futures contracts have a funding rate mechanism that usually occurs every 8 hours. If the rate is positive, long positions pay short positions. If it's negative, shorts pay longs. This mechanism helps keep the perpetual contract's price in line with the underlying spot price.
Perpetual futures contracts have become especially popular in cryptocurrency trading. They allow traders to profit from both rising and falling market trends. Also, since they don't have an expiration date, traders don't need to worry about the cost associated with rolling over contracts when they expire, as they would with traditional futures contracts. However, trading in futures, including perpetual futures contracts, carries significant risk and isn't suitable for all investors.
Let's look at the Bitcoin perpetual futures for the past 30 days for all the exchanges.
Conclusion
In conclusion, to create a comprehensive and effective Bitcoin Price Index, we believe it is paramount to consider these technical indicators.
For instance, an unusual surge in trading volume, or a distinct change in the Relative Strength Index (RSI) or On-Balance-Volume (OBV), can signify an imminent trend reversal. Similarly, the Contango or Backwardation measure from Perpetual Futures plays an essential role. While primarily used for short-term trading decisions, persistent periods of Contango or Backwardation can reflect underlying market sentiments that drive long-term price movements.
By incorporating short-term metrics into our long-term analysis, we strive to provide a more nuanced and accurate picture of Bitcoin's future price trajectory. And since they directly influence Bitcoin's price, we will mark this as "A." Let's update this in the components table :
| Indicator | Rank |
|---|---|
| BitCoin Technicals | A |
| Bank Credit | C |
| PCE | B |
| Employment Situation Report | B |
| CPI | A |
| Initial Jobless Claims | B |
Please share your thoughts on the article by clicking below Emoji ...


Disclaimer
*The content provided in the Bitconometrics: Decrypting Crypto Correlations section is intended for informational and educational purposes only. It should not be construed as financial, investment, or trading advice. The opinions, analysis, and forecasts expressed in this section are those of the authors and do not necessarily reflect the views of the entire Bitconometrics team or any associated entities.
The information provided on this cryptocurrency blog is for educational and informational purposes only and should not be construed as financial, investment, or trading advice. The authors, contributors, and administrators of this blog are not licensed financial professionals and do not hold any formal qualifications in the fields of finance, economics, or cryptocurrencies
Cryptocurrency markets, including Bitcoin, are highly volatile and can fluctuate significantly in a short period. The information presented in this section is based on historical data, current market conditions, and the authors' interpretation of various economic indicators. Although we make every effort to provide accurate and up-to-date information, there is no guarantee that any analysis, prediction, or projection will materialize or prove accurate.
Before making any financial or investment decision, we strongly recommend that you consult with a qualified financial advisor, conduct your own research, and assess your personal risk tolerance. Bitconometrics, its authors, and affiliates will not be held liable for any direct, indirect, or consequential loss or damage incurred as a result of the use or reliance on the information presented in this section.
By accessing and using the content in the Bitconometrics: Decrypting Crypto Correlations section, you agree to assume full responsibility for any investment or trading decisions you make based on the information provided herein.*