SUI vs APTOS: Unveiling the Blockchain Explorer Developer Activity Index

Welcome to the Fourth edition of "The Blockchain Explorer."
In our previous Issue, we unveiled raw data that underpins the Developer Activity Index. This index, a comprehensive composite measure, offers unique insights into the flurry of activity that characterizes blockchain development.
Now, in this current edition, we are set to dive deeper. Harnessing the power of advanced statistics, we will reveal the computed Developer Activity Index for both SUI and APTOS.
The Developer Activity Index employs a weighted system, and it will comprise six different dimensions, each measuring a different aspect of development activity.
First, let's establish the indicators for each dimension:
- Codebase Analysis (Indicators: Commits, Contributors, Repository Stars, Forks)
- Bug Tracking and Issue Resolution (Indicators: Ratio of Open to Closed Issues, Average Resolution Time)
- Version Releases (Indicator: Frequency of Version Releases)
- Community Engagement (Indicator: Forum Activity)
- Development Funding (Indicator: Amount of Funding)
- Partnerships and Integrations (Indicator: Number of Partnerships)
Next, we'll apply different weights (Our secret recipe) to these indicators based on their perceived importance in the blockchain growth cycle. Refer Third Issue for details.
To normalize the data and account for skewness or extreme values, we'll apply a transformation to the raw data for each indicator (for instance, a logarithmic transformation, if suitable).
Then, a Z-score standardization will be used to ensure comparability across different indicators and projects. The formula for Z-score is (x - μ)/σ, where x is the data point, μ is the mean of the data set, and σ is the standard deviation.
Here's the formula for the index:
Index = (W1 * Z1 + W2 * Z2 + W3 * Z3 + W4 * Z4 + W5 * Z5 + W6 * Z6)
Where:
W1 to W6 represent the weights for the six dimensions, and
Z1 to Z6 represents the Z-scores for each dimension.
This index provides a single numeric value that can be used to compare the development activity of different blockchain projects. While the Index provides a single numeric value to represent development activity, it's essential to interpret this value in the broader context of each project's unique dynamics and particularities.
Additionally, this does not account for the unique dynamics and particularities of each blockchain project, which can influence the impact of different factors on the project's development activity. Therefore, this index will evolve, and I might change the weights of each dimension for accuracy.
SUI vs APTOS: An In-depth Look at the Developer Activity
We have extensively covered them in Issue II of The Blockchain Explorer; now, let's dig deeper into the Dev activity using the Index. This will allow us not only to understand the intensity of developer activity for each blockchain project but also to draw meaningful comparisons between the two.
Critical points to consider
- This is the first reading, so mean and standard deviation are unavailable. Therefore, We'll use the actual data for our analysis.
- Both SUI and APTOS are in Stage ZERO (0 - 1 Year). This early stage could impact the weights of each dimension for the Developer Activity Index.
- Specific information about development grant limits for either SUI or APTOS is not released yet. As such, this dimension will be excluded from the index for this analysis.

Conclusion
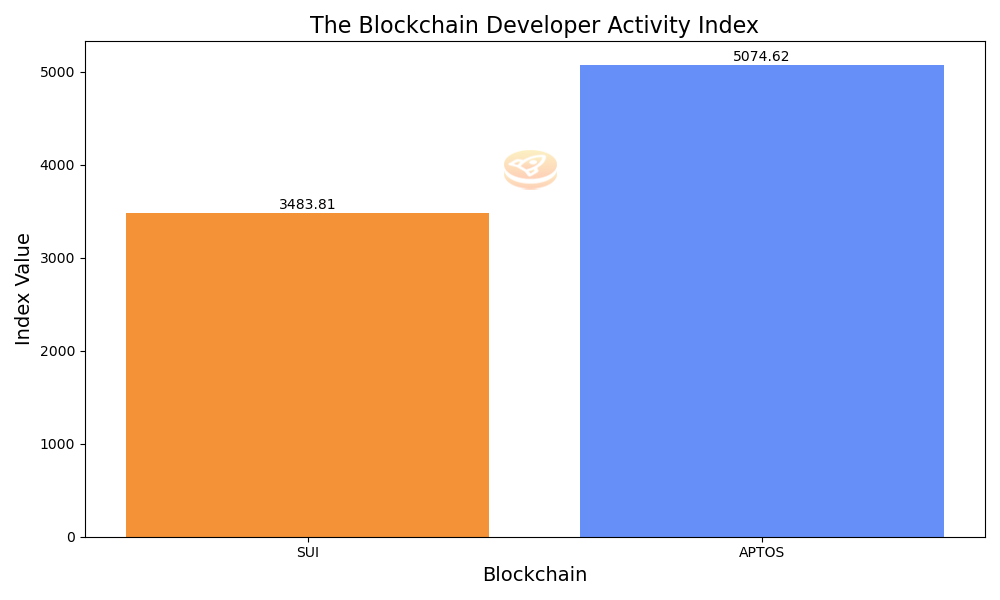
In Conclusion, Based on our Developer Activity Index, APTOS holds a significantly higher index value of 5074.625 compared to SUI's 3483.81, an impressive 45.6% higher. The APTOS Mainnet, having launched in October of the previous year, has had more time to gain traction and development momentum, which is reflected in its superior index value.
However, it's important to note the remarkable progress that SUI has been making. Despite being a newer addition to the blockchain landscape (Mainnet was launched this Month, May itself, SUI is showing promising signs of catching up with its more established counterpart, highlighting the dynamism and the potential of its development team.
Our Developer Activity Index offers a snapshot of the current landscape, but it's crucial to remember that this landscape is dynamic and ever-evolving. Therefore, we will revisit these metrics on June 26th to review how these two blockchains progress.
Stay tuned...
Please share your thoughts on the article by clicking below Emoji ...
Disclaimer
*The information and analysis provided in "The Blockchain Explorer" section are intended for educational and informational purposes only and should not be considered as financial, investment, or professional advice. While our team strives to ensure the accuracy and reliability of the content, we make no representations or warranties of any kind, express or implied, about the completeness, accuracy, reliability, suitability, or availability of the information presented.
The content within "The Blockchain Explorer" may include opinions and forward-looking statements that involve risks and uncertainties. The blockchain and cryptocurrency markets are highly volatile, and past performance is not indicative of future results. Any reliance you place on the information presented is strictly at your own risk. Before making any investment decisions, we highly recommend consulting with a qualified financial advisor or conducting your own thorough research.
By accessing and using the information provided in "The Blockchain Explorer," you acknowledge and agree that neither the authors, publishers, nor any other party involved in the creation or delivery of the content shall be held liable for any direct, indirect, incidental, consequential, or punitive damages, including but not limited to loss of profits, goodwill, or data, arising out of your use or inability to use the information provided or any actions you take based on the information contained within this section.*


